There may be some situations where we need to monitor our JDBC calls. There are few mechanisms available for monitoring JDBC calls. I have tried JDbMonitor in some of my projects because it is easy to use and remove without any code change.
JDbMonitor works as a proxy between our application the JDBC driver. Essentially there may be some performance issue if we use this in a production environment. JDbMonitor provides a GUI application to monitor our JDBC calls.

image credit : http://www.jdbmonitor.com
In the current version(1.1) it supports
- Statemt
- PreparedStatement
but callable and batch operations are not supported yet.
Lets have a look on how to configure JDbMonitor to monitor our JDBC calls in step by step.
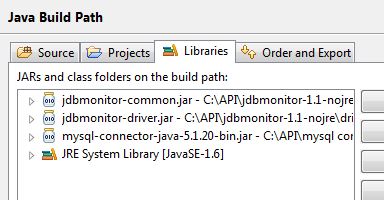
Step 1 : Add (jdbmonitor-driver.jar,jdbmonitor-common.jar and the JDBC driver) to your class path.
In my case I am using MySQL driver.
Step 2 : Point JDBC Driver to com.jdbmonitor.MonitorDriver where the connection is created.
package com.kani;

import java.sql.Connection;
import java.sql.DriverManager;

public class ConnectionManager {

 private static final String HOST="localhost";
 private static final String DBNAME="test_db";
 private static final String USERNAME="root";
 private static final String PASSWORD="";


    public static Connection getNewDBConnection() {
        Connection conn = null;
        try {
            Class.forName("com.jdbmonitor.MonitorDriver");
            conn = DriverManager.getConnection("jdbc:mysql://"+HOST+"/"+DBNAME, USERNAME, PASSWORD);
        } catch (Exception e) {
            e.printStackTrace();
        }
        return conn;
    }
}
Step 3 : Run jdbmonitor client program. and connect(f2)

it should show all the supported JDBC operations if it is connected successfully.

Note : If you are using a property file you can remove JDBmonitor without any code change. And it is possible to monitor underlying Hibernate JDBC operations easily.


0 comments:
Post a Comment